This post describes how to export metrics from bhyve based virtual machines and Jails managed by Sylve on FreeBSD by my Prometheus exporter. The focus is on collecting reliable data from the host system without relying on tooling that was primarily designed for Linux hypervisors or assumes the existence of hypervisor level counters.
Monitoring bhyve workloads on FreeBSD is different from monitoring virtual machines on other platforms. bhyve virtual machines run as regular userland processes and typically use ZFS datasets or zvols for storage. As a result, many of the metrics that are commonly available on other hypervisors do not exist in the same form on FreeBSD. This often leads to confusion when trying to apply standard monitoring approaches that expect per vCPU statistics or detailed hypervisor telemetry. While this is easily possible in Proxmox VE, this was missing for me in bhyve.
Despite these differences, there is still a strong need for observability. Operators need insight into CPU usage, memory consumption, and disk I O behavior in order to operate stable systems and diagnose performance issues. Looking only at host wide metrics or relying exclusively on exporters inside the guests often hides important details, especially when dealing with resource contention or storage related problems. The approach presented in this article follows the FreeBSD model instead of working around it. Metrics are derived from the bhyve process itself, from ZFS as the authoritative storage layer, and from well defined kernel and userland interfaces. This results in a monitoring setup that is accurate, predictable, and easy to reason about.
Components Overview
The solution (you can find the sources at gyptazy/sylve-bhyve-exporter) presented in this post consists of a small set of clearly defined components that work together to provide visibility into bhyve based virtual machines and Jails managed by Sylve on FreeBSD. Each component has a specific responsibility and follows common FreeBSD and Prometheus best practices.
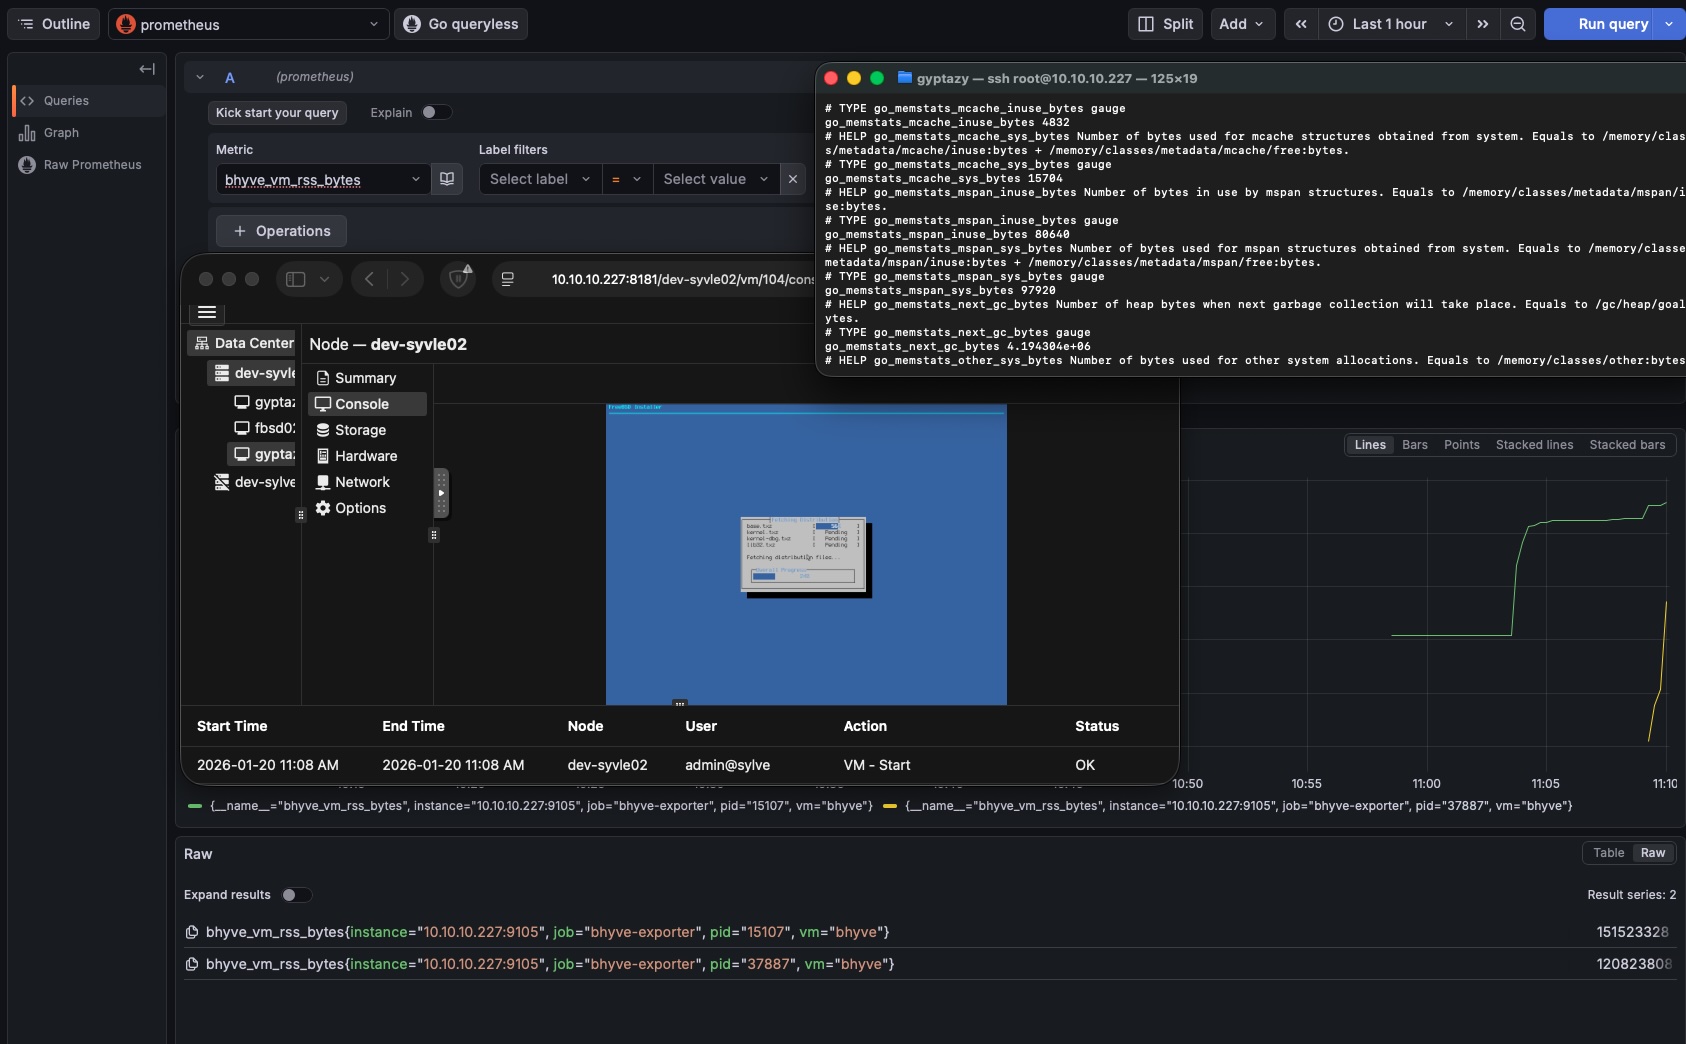
At the core of the setup is a custom exporter that gathers metrics directly from the host system. It focuses on CPU usage, memory consumption, and disk I O by observing bhyve processes and ZFS datasets. The collected data is then exposed in a Prometheus compatible format and visualized using Grafana.
All components are intentionally kept simple and transparent. There are no hidden dependencies or complex abstractions, which makes the setup easy to understand, debug, and maintain over time.
Included Components
-
sylve-bhyve-exporter
A lightweight metrics exporter written in Go. It runs on the FreeBSD host and collects CPU and memory metrics from bhyve processes as well as disk metrics from ZFS datasets and zvols. The exporter exposes these metrics via an HTTP endpoint that can be scraped by Prometheus. -
rc.d service
A native FreeBSD rc.d service script that manages the lifecycle of the exporter. It ensures that the exporter starts automatically at boot and integrates cleanly with the standard FreeBSD service management framework. -
Grafana dashboard
A prebuilt Grafana dashboard that visualizes the exported metrics. It provides an overview of CPU usage, memory consumption, and disk activity per virtual machine, making it easy to identify load patterns and potential bottlenecks.
Together, these components form a complete and FreeBSD native monitoring solution for Sylve managed bhyve virtual machines and Jails. They can be deployed independently or as a whole, depending on the requirements of the environment.
Installation
This section describes a simple installation process for deploying the exporter on a FreeBSD bhyve node. The setup consists of installing the exporter binary, registering it as an rc.d service, and configuring Prometheus to scrape the exposed metrics. A Grafana dashboard can then be used to visualize the collected data.
Install on FreeBSD bhyve node
Download the exporter binary and place it in a suitable location on the system. Make sure the binary is executable.
cd /usr/local/bin/
fetch https://cdn.gyptazy.com/freebsd/sylve-bhyve-exporter/sylve-bhyve-exporter
chmod +x /usr/local/bin/sylve-bhyve-exporter
Next, install the rc.d service script so the exporter can be managed using the standard FreeBSD service framework.
cd /usr/local/etc/rc.d/
fetch https://cdn.gyptazy.com/freebsd/sylve-bhyve-exporter/rc.d/sylve-bhyve-exporter
chmod +x /usr/local/etc/rc.d/sylve-bhyve-exporter
Enable and start the service.
sysrc bhyve_exporter_enable=YES
service bhyve_exporter start
Prometheus scrape configuration
Add the following scrape configuration to your Prometheus configuration file. Adjust the target hostname if needed.
scrape_configs:
 - job_name: "bhyve-exporter"
 scrape_interval: 10s
 scrape_timeout: 5s
 static_configs:
 - targets:
 - "node01.lab.gyptazy.com:9105"
After reloading or restarting Prometheus, the exporter should appear as an active target.
Grafana dashboard
Import the provided Grafana dashboard JSON into Grafana and select the appropriate Prometheus data source. The dashboard JSON can be obtained from the following location:
https://cdn.gyptazy.com/freebsd/sylve-bhyve-exporter/grafana/sylve-bhyve-exporter.json
Once imported, the dashboard will display CPU usage, memory consumption, and disk activity for the bhyve virtual machines managed by Sylve.
With these steps completed, the monitoring setup is ready for use.
Conclusion
This project fills a gap that has existed for a long time in my own setups. Agent less monitoring and obtaining meaningful metrics from running guests has always been something I missed when using bhyve in the past, especially while working on the BoxyBSD project. While bhyve is a solid and well designed hypervisor, the lack of simple and reliable observability tooling made it harder than necessary to operate larger environments.
With the current planning to move back to bhyve from Proxmox, this missing piece became relevant again. I have outlined the reasons and ideas behind this decision in a previous talk, which can be found here: BoxyBSD_Virtualization_Hypervisor_bhyve_Proxmox_credativ_gyptazy.pdf . During this process it became clear that proper host level metrics for bhyve guests were still missing, and that existing solutions did not match the FreeBSD and ZFS based architecture.
The exporter and dashboard described in this post are a first step toward closing that gap. The current implementation is intentionally basic and focuses only on CPU usage, memory consumption, and disk metrics. These are the most important building blocks for understanding system behavior and diagnosing common issues. At the same time, the design leaves room for future improvements and extensions.
This is not meant to be a finished solution, but a foundation. Additional metrics, better correlations, and further refinements are planned as real world usage grows. The goal is to provide a simple, FreeBSD native, and transparent way to monitor bhyve based virtual machines and Jails without introducing unnecessary complexity.