With version 0.9.8, PegaProx now includes a native Prometheus exporter. This makes it much easier to collect metrics directly from your environment without relying on additional tools or complicated setups.
The collected metrics can be integrated seamlessly into Grafana, allowing you to visualize and analyze them in a clear and structured way. This improves visibility across your infrastructure and helps you better understand performance and overall system health. For this purpose, I created a Grafana dashboard for PegaProx that brings all of these metrics together in one place. It includes data from:
Based on this, you can quickly integrate this into your Grafana instance by adding a new scrape config to your Prometheus and importing the new dashboard into your Grafana.
Prometheus Scraping Configuration for PegaProx
To collect metrics from PegaProx, you need to configure Prometheus to scrape the built-in exporter endpoint. Since the metrics endpoint is secured, a few additional settings are required compared to a default scrape job.
PegaProx exposes its metrics over HTTPS on port 5000 under the path /api/metrics. Because of this, you must explicitly enable TLS in your Prometheus configuration. In addition, authentication is required, so you need to create an API token in PegaProx and pass it along with each request.
A minimal scrape configuration could look like this:
 - job_name: 'pegaprox'
 metrics_path: /api/metrics
 scheme: https
 authorization:
 type: Bearer
 credentials: pgx_token123token123
 tls_config:
 insecure_skip_verify: true
 static_configs:
 - targets: ['pegaprox01.int.gyptazy.com:5000']
After adding the configuration, don't forget to reload/restart your Prometheus instance to source the new scrape point.
Grafana Dashboard
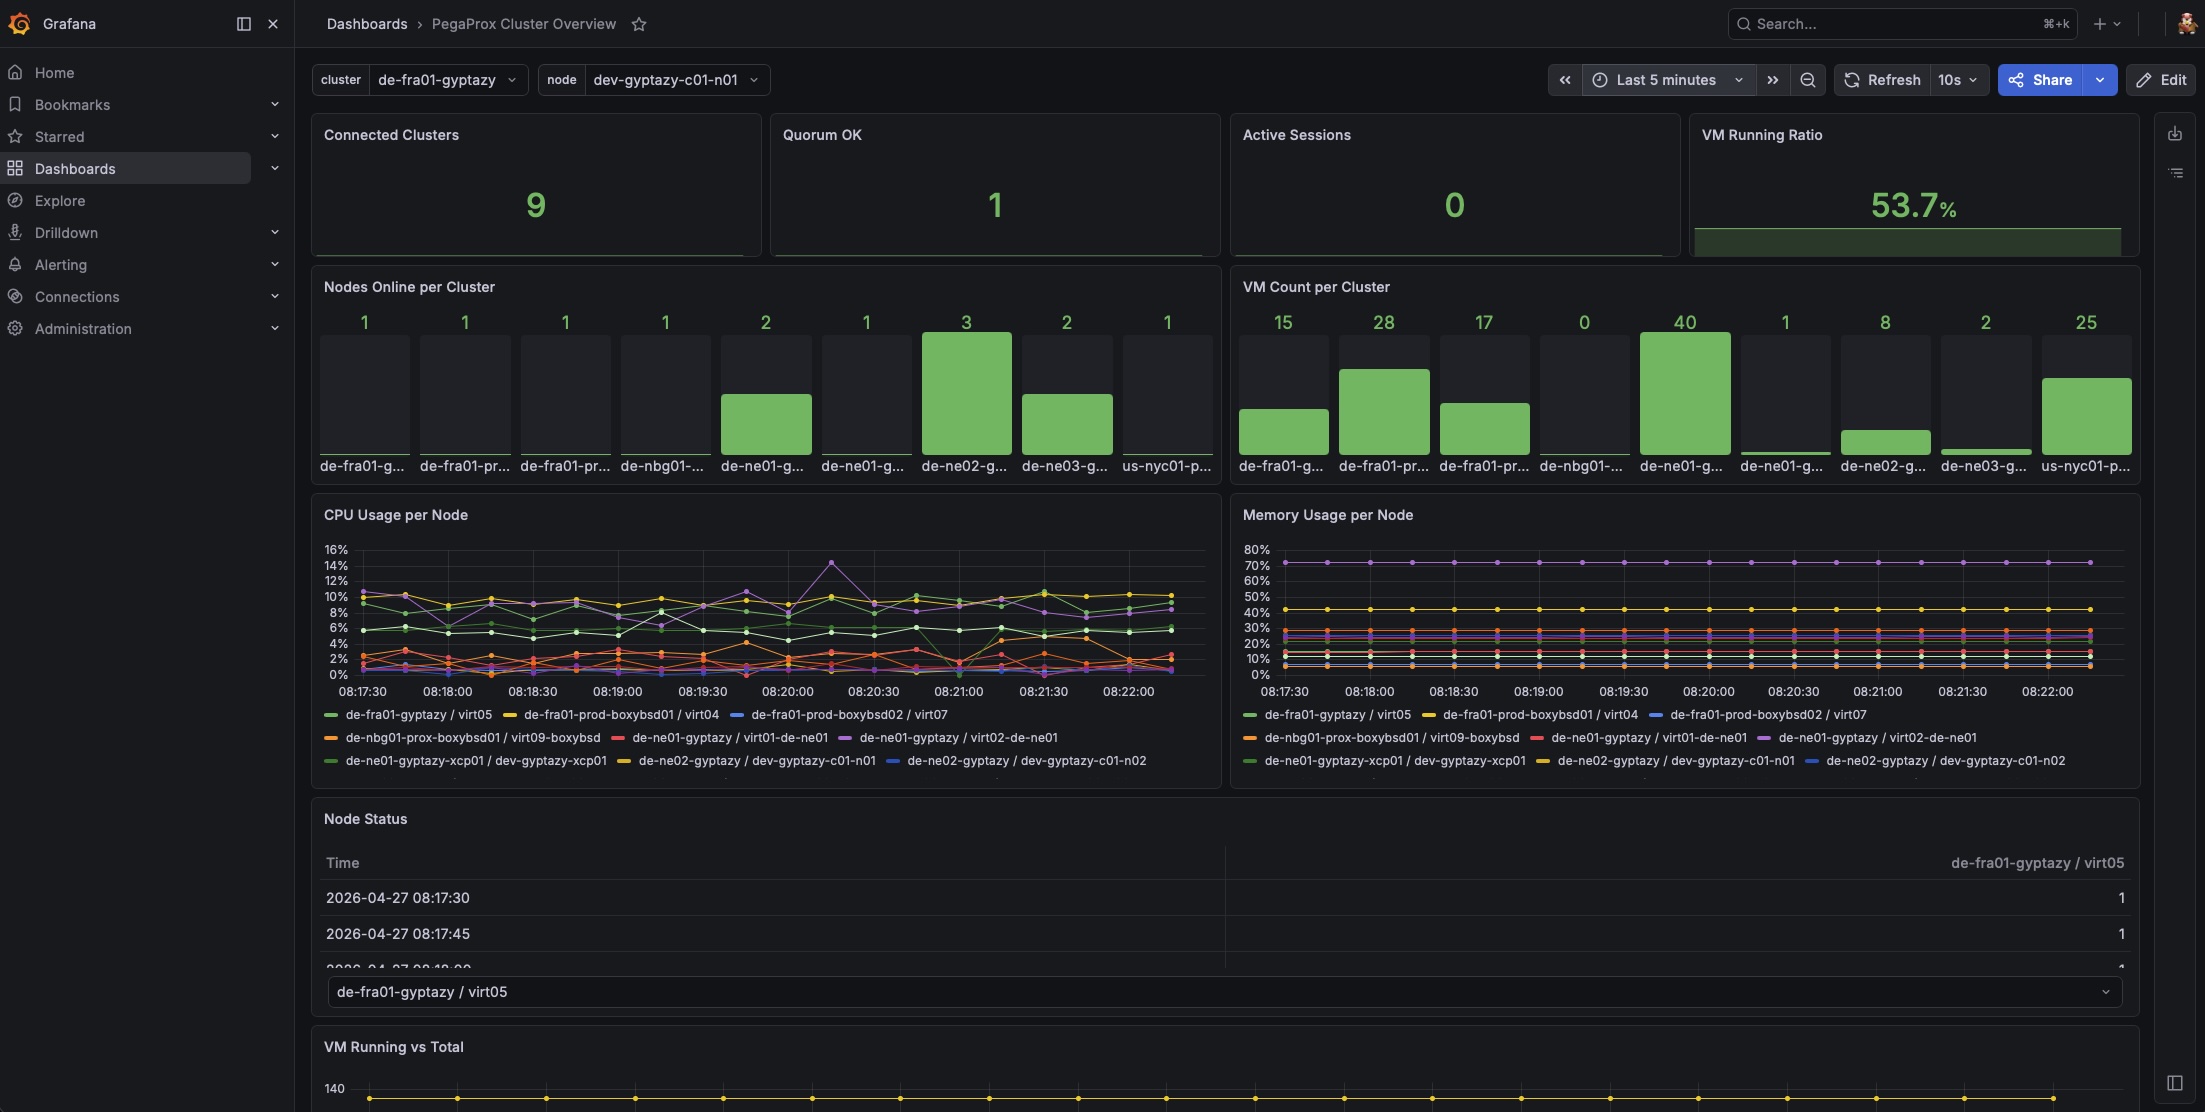
The PegaProx Cluster Overview dashboard in Grafana gives a quick and clear view of the metrics collected by Prometheus from PegaProx. At the top, you get the most important status information at a glance. This includes how many clusters are connected, whether quorum is healthy, how many sessions are active, and what percentage of virtual machines are currently running.
The next section shows how your clusters are structured. You can see how many nodes are online per cluster and how many VMs each cluster contains, which makes it easy to spot imbalances or partial outages. For performance monitoring, the dashboard displays CPU and memory usage per node over time. This helps to quickly identify overloaded systems or unusual trends. There is also a simple table showing the current node status, so you can immediately see which nodes are online or offline.
Another panel compares running versus total VMs, giving you a better understanding of overall workload and utilization. At the bottom, you will find connectivity indicators for Proxmox Backup Server and VMware, so you can quickly verify that external systems are reachable.
You can also filter the entire dashboard by cluster or node, which makes it easy to focus on specific parts of your environment.
Download: pegaprox_grafana_dashboard_v1.0.json