
HowTo: Add a Proxmox related Metrics to Prometheus & Grafana
Monitoring and managing virtual environments effectively is crucial for maintaining optimal performance and resource allocation. With Proxmox VE, administrators can easily view all metrics of running containers and virtual machines, both on individual nodes and across an entire cluster. This centralized visibility provides real-time insights into resource usage, allowing for better oversight of disk, CPU, network, and memory metrics for each VM. By having access to these specific metrics, it becomes significantly easier to identify resource-consuming guests, leading to more efficient troubleshooting, resource balancing, and performance optimization. This comprehensive monitoring enhances the overall management and scalability of virtual infrastructures.
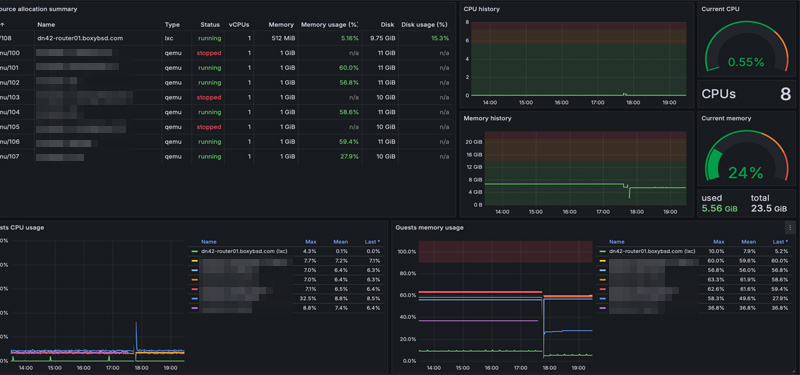
With the Prometheus-PVE-Exporter, this can be easily and quickly integrated into already existing cluster setups. By its simplicity in configuration, this can also be quickly integrated into automation and config management to ensure that new clusters will also be deployed with this exporter. Metrics are visualised in a very attractive way by the Proxmox Grafana Dashboard (ID: 10347) which can simply be imported.
Configuration
First, the user permissions on the Proxmox VE cluster must be created. Obtaining the metrics only requires the PVEAuditor role and the user should be limited to this role.
pveum user add prometheus-pve-exporter@pve -password $password
pveum acl modify / -user prometheus-pve-exporter@pve -role PVEAuditor
Afterwards, a shell user and the exporter itself can be installed. It might also be considered to install the prometheus-pve-exporter into a Python venv to avoid any dependency conflicts. However, I never encountered any of them and always use it that way.
useradd -s /sbin/nologin prometheus-pve-exporter
pip3 install prometheus-pve-exporter
The exporter’s configuration file is followed which will be added to potential other exporters.
/etc/default/pve_exporter.yml
default:
    user: prometheus-pve-exporter@pve
    password: $password
    verify_ssl: false
The configuration file should be adjusted by the correct permissions that have been previously defined.
chown root:pve-exporter /etc/default/pve_exporter.yml
chmod 640 /etc/default/pve_exporter.yml
Ensuring that the service will be always running, the following systemd unit is being created.
/etc/systemd/system/prometheus-pve-exporter.service
[Unit]
Description=Prometheus Proxmox Exporter

[Service]
Restart=always
User=prometheus-pve-exporter
ExecStart=/usr/local/bin/pve_exporter --config.file  /etc/default/pve_exporter.yml

[Install]
WantedBy=multi-user.target
Finally, the systemd daemon can be reloaded and the newly created systemd unit file started.
systemctl daemon-reload
systemctl enable prometheus-pve-exporter.service
systemctl start prometheus-pve-exporter.service
Ressources
- Proxmox Grafana Dashboard (ID: 10347)
- Prometheus-pve Exporter