
HowTo: Proxmox Backup Server – Prometheus Exporter & Grafana Dashboard
Proxmox Backup Server is an essential tool for anyone running Proxmox Virtual Environment (PVE) or managing backups efficiently in a virtualized setup. It provides a high-performance and deduplication-enabled backup solution that ensures data protection while keeping storage demands in check. But like any critical infrastructure component, monitoring its performance and status is key to ensuring smooth operations and quick troubleshooting.
This is where integrating metrics into a single solution, like a Prometheus and Grafana setup, becomes invaluable. Instead of manually checking logs or relying on periodic status reports, a well-integrated monitoring system provides real-time insights into the health and performance of the backup server. With Prometheus scraping metrics and Grafana visualizing them in intuitive dashboards, administrators gain a clear view of key indicators such as backup job status, storage utilization, performance bottlenecks, and potential failures. This proactive approach helps to detect issues before they escalate and ensures that backups are always running optimally.
In this HowTo guide, we will set up Prometheus monitoring for Proxmox Backup Server by running the prometheus-pbs-exporter (from Natrontech) directly on the Proxmox Backup Server itself. This exporter provides the necessary metrics for Prometheus to collect, making it easier to monitor backup processes, disk usage, and system performance from a centralized monitoring stack. For those who prefer containerized environments, this exporter can also be run in a Docker container, offering a flexible alternative for different infrastructure needs.
Installation
General
The default assumption of the project is to run the Exporter in a dedicated (Docker) container. However, this might not always fit the needs of operators running a virtualization infrastructure where no further container infrastructure is present. For this reason, I created the PR feat: Add systemd unit file and support to run on PBS #99 in the upstream project which adds further instructions how to install and use this on a PBS instance and added the required systemd unit file. As of now, this PR is open and not yet merged. As a result, we will use the upstream project and my fork for the installation and configuration.
Downloading the Packages
We can simply start on the Proxmox Backup Server itself to download the required package (for Linux as amd64), systemd unit file and to create a dedicated user who runs the pbs-exporter process later. Therefore, we can simply run the following commands:
# Download prometheus-pbs-exporter
mkdir /opt/pbs-exporter
cd /opt/pbs-exporter
wget https://github.com/natrontech/pbs-exporter/releases/download/v0.6.4/pbs-exporter_v0.6.4_linux_amd64.tar.gz
tar xfvz pbs-exporter_v0.6.4_linux_amd64.tar.gz
cp pbs-exporter-linux-amd64 /bin/

# Create a dedicated user for running the prometheus-pbs-exporter
useradd -m pbs-exporter -s /sbin/nologin

# Download systemd unit file (currently from gyptazy)
cd /etc/systemd/system
wget https://raw.githubusercontent.com/gyptazy/pbs-exporter/refs/heads/main/systemd/prometheus-pbs-exporter.service
systemd daemon-reload
Configuration in Proxmox Backup Server GUI
Simple as this was, we need to create a new API token to gather the metrics by the installed pbs-exporter. Therefore, you need to login to your Proxmox Backup Server and to create a new API token.
This can be achieved by accessing the Access Control chapter in the Configuration part:
- Configuration
- Acces Control
- API Token
- Add
- API Token
- Acces Control
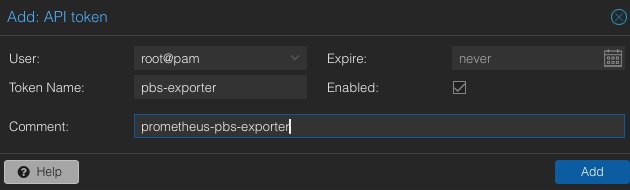
In this window, we now select an already existing user (for simplicity it’s here root@pam) and set pbs-exporter as Token name. After adding the token name, you get only for a single time the related token shown. Save it immediately for later usage!
Note: This is the easiest setup to get on track. For security reasons, please create a dedicated user, including a new dedicated API token. Defining a dedicated user requires you to define this also for the systemd unit file, while the exporter auto assumes you to run this as root@pam with the token name pbs-exporter.
Configuration in Proxmox Backup Server CLI
After creating the token, an environment file including the credentials is required. Therefore, we simply create the file /etc/pbs-exporter.env. This file will contain our information that are sourced by the systemd unit and include some parameters. The minimum required information is the token, when using the defaults of the exporter. Take care about the note in the previous chapter that you also need to define the user and token name when using a different user (which is highly recommended).
Configuration
As a minimum, the token must be defined to access the metrics with the exporter. However, you also have the option to disable the SSL certificate validation which might be needed when using untrusted or self-signed certificates. For production setups, please use valid certificates.
TOKEN=beef-1337-cafe-beef-cafe-1337
INSECURE=false
After setting the values in our environment file in /etc/pbs-exporter.env we can finally enable and start our pbs-exporter by running the following systemd commands:
systemctl enalbe prometheus-pbs-exporter.service
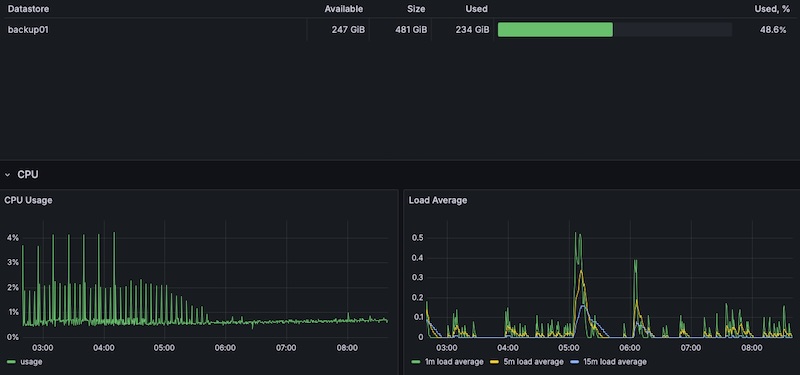
systemctl start prometheus-pbs-exporter.serviceGrafana Dashboard
The last step results into importing the Grafana dashboard for the pbs-exporter. Luckily the project already ships a Grafana dashboard in its source project and you can simply download the pbs-exporter dashboard and import it in the web ui of Grafana.